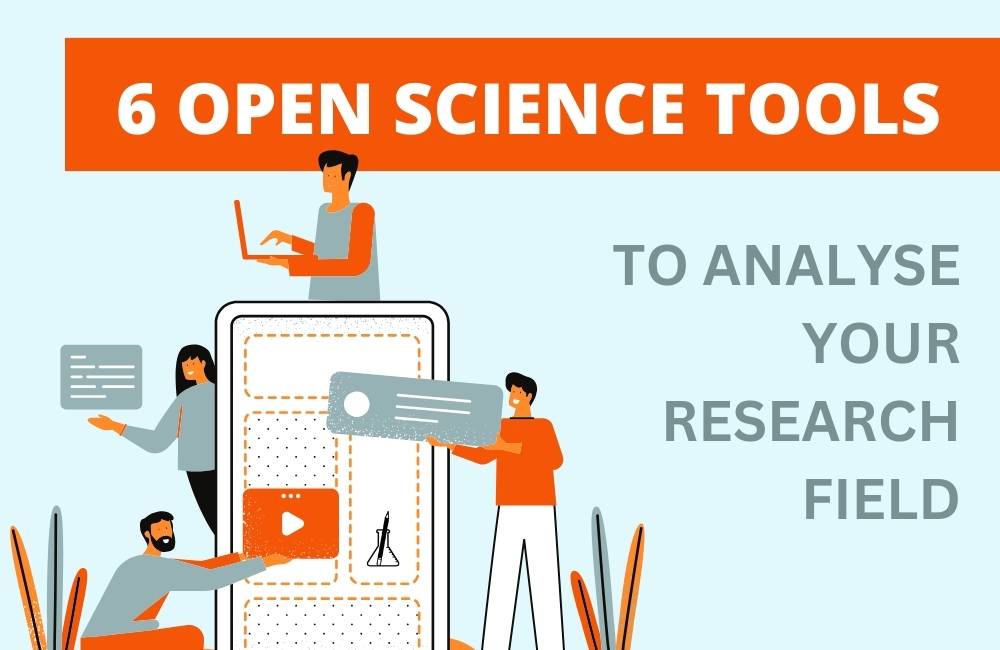
This is the final part of the 3-part blog series on Open Science tools that I want you to know about! In this post, I’m introducing 6 neat tools that allow for in-depth analyses of research fields by connecting open scholarly data. Be sure to also check out part 1 and part 2 of the series if you want to utilise more Open Science tools!
Open Science is growing. What started as an idea to introduce you to a handful of Open Science tools, ended up as a three-part blog series. There are just too many fantastic tools that I want you to know about! In the past two blog posts, I presented Open Science tools that assist specifically with searching the literature and publishing papers.
In this blog post, I would like to acquaint you with a type of Open Science tools that connect openly available research-related data. With that I mean data on the researchers themselves (e.g., published papers, patents, collaborators, affiliations), their papers (e.g., citations, journals) or whole research topics (e.g., researchers, journals).
And establishing connections between the wealth of available research-related data is really powerful – especially when you can visualise those connections. Why powerful? Connecting research data helps with two things: discovering knowledge and assessing researchers.
I already presented a range of Open Science tools that help with discovering knowledge in part 1 of this series focusing on the literature search when writing papers. The tools in the current post come into play when you seek to get a bigger picture of your field, for example when looking for new research ideas, preparing conference talks or writing grant proposals.
So far so good. But how can these webs of research-related data influence the assessment of researchers? Currently, most institutions evaluate researchers solely based on their publications. The Open research data networks may have the power to change this system. They offer the possibility to get a more comprehensive picture of a researcher’s scholarly activities.
Making sure that your research data is openly available isn’t only useful for others to assess you, but also for you to learn more about potential collaborators or applicants for open positions in your lab.
So, here we go: 6 Open Science tools for analysing your research field that I think you shouldn’t miss!
ORCID
ORCID stands for Open Researcher and Contributor Identifier. The not-for-profit organisation behind ORCID set out to unambiguously link a researcher to their research. Apart from a publication list, the platform centralises all your scholarly accomplishments such as affiliation and education records, received fellowships, awards and grants as well as peer review contributions. ORCID sources the data from (among others) Crossref who create persistent links to publications in the form of DOIs. ORCID also integrates with other databases and services, so you can, for example, sync it with your LinkedIn profile.
Creating your ORCiD really is a must nowadays (some publishers even require it upon paper submission). If you don’t have one yet, it’s about time!
Publons
A Publons profile tracks your publications, citation metrics, and your – otherwise largely invisible – efforts as peer reviewer or journal editor. You can automatically update your profile with data from ORCID, Web of Science or your reference manager. Publons is part of the commercial Web of Science Group, owned by Clarivate.
As far as I can see, Publons doesn’t offer much more information than is already provided by ORCID but the interface does look better.

ImpactStory
On ImpactStory, you can create a researcher profile that tracks the online buzz your research has generated. Your ImpactStory profile populates when one of your papers gets mentioned on Twitter, a blog or a news outlet. On the platform, researchers can earn achievements for publishing their papers with open access and streaks for having people talk about their research online continuously for consecutive months. ImpactStory was created by the team that is also behind the tool Unpaywall, which I introduced in part 1 of the series and is funded by several foundations who support Open Science.
Dimensions
Dimensions is a powerful AI database that connects a large variety of research-related data such as grants, papers, patents, datasets, online mentions, clinical trials and policy documents. As a researcher, you can use the application in various ways: identifying suitable collaborators, gathering data on a certain research topic for a report or grant proposal, and finding out quickly which patents or clinical trials are connected to a certain research paper or who has cited and used your research – to name just a few.
Dimensions also features expansive researcher profiles, and you can sync your ORCiD (see above) with your Dimensions profile to make your ORCID more comprehensive.
Dimensions is a part of the company Digital Science that also owns figshare (included in part 2 of this series). Accessing the full set of stored data comes unfortunately with a cost. However, the company provides a free version for personal use that at least allows you to search all publications and discover all their linked information, such as the connected funders, the authors’ researcher profiles, underlying datasets etc.
I played around with the free version a bit and searched for my own name. While all the expected publications came up from my time as a PhD student and before, I also found out that someone referenced my blog and my strategies to using storytelling in a book they wrote. I wasn’t aware of this, what a fun discovery!
Scholia
The webtool Scholia creates visual scholarly profiles for individual researchers, organisations, publishers and research topics by accessing data stored in the open knowledge base Wikidata. You can choose between a wide range of visualisations such as publication timelines, collaboration networks, author bubble plots, citation distributions of journals, citation maps and more.
For example, Scholia can create a graph showing the most prolific authors and their key co-authors or a citation network of the countries that the researchers with the highest publication output are associated with.
Scholia also allows you to visualise citation distributions of journals (how many papers received a certain number of citations), which can provide a more insightful impression of a journal’s quality than just the impact factor.
While the plots don’t look as good as those produced by Dimensions (above) or SciGraph (below), Scholia is not commercial and is completely free to use. Just be aware that the data sets Scholia has access to may be incomplete.
SN SciGraph
The publishing house Springer Nature also offers a tool that collates research-related data called SciGraph. The program visually connects data on all Springer Nature publications and related information such as authors, research projects, conferences, affiliations and patents. It is free to use!
There you have it. 6 Open Science tools that help you analyse your research field, both the researchers and the created knowledge.
This was the final part of our 3-part series on Open Science tools. I hope I could inspire you to try out a new program or platform.
Which of the tools listed above are you most excited to try out? Please share with us in a comment below!

Procrastinating on your writing? Not feeling like you’re effective at communicating clearly and/or getting desk-rejected a lot?
In this free online training for science researchers, Dr Anna Clemens introduces you to her step-by-step system to write clear & concise papers for your target journals in a timely manner.